Initial Test of Solar Oven Simulation

by Curlydock
Nov 15, 2007

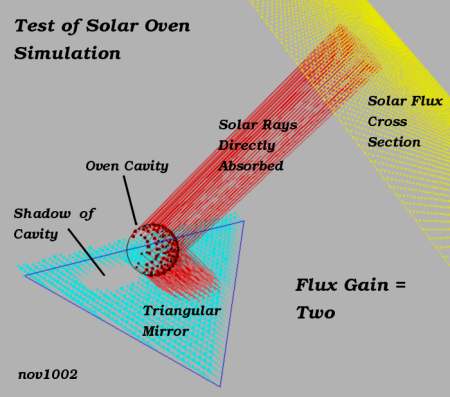
The diagram labeled “nov1002” displays a rudimentary test of my solar oven simulator. From this I hope to begin to see if the program is behaving correctly.

nov1002a.jpg

The oven cavity is seen as a ball above a triangular mirror.

A cross section of the solar flux is seen in yellow above right.

Any ray absorbed by the cavity is drawn in red. This could be either a ray directly from the sun or a ray reflected from the triangular mirror.

A ray reflected from the mirror that is not absorbed by the cavity is drawn as a short light blue vector. Any time a vector is drawn, the direction is indicated by the small ball at the end, which could be interpreted as an arrow head.

To reduce clutter in the diagram, the rays reflected and lost to space are drawn very short. They appear as a sort of light blue haze over the triangular reflector. You can see the “shadow” of the cavity on the mirror. Rays that neither hit the cavity nor the reflector are not drawn at all.

The program calculated the solar flux gain in this case to be 1.974359. This means that the cavity received almost twice as much solar radiation as it would have without any reflector at all. This is precisely what I would expect. The flux received by the cavity directly is doubled by the presence and proper placement of the mirror. The cavity would “see” two suns: one directly and the other reflected. Reciprocally, the sun would “see” two cavities, also one direct and one reflected. The analytical solar flux gain is two.

The theoretical flux gain without any reflector would be exactly one. That would be the minimum ever seen. Any properly directed reflections will increase that. The flux gain is calculated by dividing the quantity of rays absorbed with mirror concentrators in place by the quantity that would be absorbed directly from the sun when there are no mirrors. The simulation counts the rays and calculates the gain.
To see the importance of mirror orientation, we next consider what happens when the sun is at different angles, everything else remaining the same.

nov1003a.jpg

Diagram nov1003 shows how the flux gain drops to nearly unity when the sun is at a very low angle. The reason is that the triangular mirror is not of infinite extent. If it could be made large enough, we could get our gain back up to two. Thus the physical trade-off for the solar concentrator with the sun at small angles to the surface.

nov1004a.jpg

Diagram nov1004 shows the other extreme. Here, the sun is nearly at the zenith, but again the gain has dropped to nearly unity. This time the reason is that the cavity obscures the sun’s reflection. Where the cavity would “see” the sun it now only sees itself. The sun can only see the direct image of the cavity. The reflected image of the cavity is mostly hidden from the sun by the cavity itself.

These preliminary results continue to indicate that the simulation is correct.

Next, we can have the simulation sweep the solar altitude angle from zero degrees (on the horizon) to 90 degrees (at the zenith) and graph the flux gain against the solar angle. The triangular reflector is in the horizontal plane and therefore parallel with the horizon.

nov1005a.jpg

Diagram nov1005 shows the results of just such a sweep. We see the flux gain peaks at 2.0 broadly when the sun is around a 50.0 degree angle and falls to unity when the angle of the sun is either much more or much less than that.

In conclusion, the program I wrote to simulate some types of solar ovens seems to be working so far. I do still have reservations. There is more testing to do.

In future posts I hope to show the results of adding more reflecting flux concentrators. The flux gain will go up much more quickly with each added reflective plane as each added reflector exponentially increases the number of images (as in a kaleidoscope) while the increase in the number of mirrors is only linear. But limitations due to image obscuration, as we have already seen here, will subtract from the advantage of adding more reflectors, producing diminishing returns.

Some factors that affect real physics of multiple reflections I am going to ignore. I feel they would add a great deal of complexity without proportionally increasing the accuracy, at least for my purposes.

One of these factors is that every time a light beam is reflected, there is some loss. The amount of loss depends upon the angle of incidence. In my program, so far, this type of loss is not deliberately encoded. I assume no such losses.

Another factor is that no real reflector is perfect. Imperfect reflective surfaces will throw the light ray off at a non-ideal angle. Nor do I try to account for this effect.

Another factor is that I have some doubt about whether my program, as it is currently written, will ray-trace beyond about 4 or 5 reflections. I am not sure if this is true or why it happens if it does occur. I am keeping a look out for the effect but am not letting this doubt stop me from reaching for some results.

There may be other factors that have escaped my wildest dreams; who knows?

This work I put in the public domain for purposes of information and I do not claim it is perfect and suitable for just any application. If you are interested in seeing the listing, I am willing to share it. I can post it later.
Sourdough Starter as Ecological Model

By Curlydock

Ever wonder what your sourdough starter gets up to when you are not looking? I spied on mine with a web-cam for about a day. Now I know the shocking truth of its secret life and will show and tell all in this installment.

Why care

about this? There are several parallels between what happens when you feed your sourdough starter and what has happened on this very planet Earth when the human population began to explode.

In both cases, there is a population of living things in an environment that is limited in size and resources.

The sourdough starter is populated with yeast and bacteria in symbiosis. It needs flour for the population to grow and will consume it all if you do not replenish it. Then, there is a die off or crash in the population as a result of starvation, resource exhaustion and poisoning by the accumulation of waste material. Sound familiar?

Earth is populated with people, all the species that people depend upon, and many species relegated to “weed” category, thought of as expendable because we have not yet figured out how to exploit them. Ecologists and those who understand the need for organic farming methods are among the precious minority who value species diversity. As much as we like to think we can dominate nature, the real truth is that we are also symbiots. Our determination to dominate instead of live in harmony is driving the planet and all its populations into a dead-end.

The sourdough starter cannot grow out of it’s jar. (Well, it can but is not likely to find more flour if it does.) The human population cannot leave this planet in any significant numbers any time soon. (And, even if it does, how much organic coffee can we grow on the moon?)

Perhaps the sourdough starter can teach us something about mindless consumption and procreation. “But”, you may protest, “Unlike yeast, people have minds!” I will counter: “A person in a state of denial behaves automatically and just as if they do not have a mind.” Mindless consumers. Purchase what you don’t need. Throw the left-overs in the gutter. Make babies like the world was going out of style. Well, perhaps it is.

The sourdough starter needs flour. Unless you replenish it, the starter will consume all that is available.

The human population of Earth has developed a crippling dependance on oil and other limited resources. Even if we don’t run out of coal and oil, we cannot continue to use them because their use in this already over-populated planet is what is triggering global warming. So, discovering vast new supplies of cheap oil is no solution. In fact, it could aggravate the real problem. Irony.
Procedure

I mixed 54 g of flour with 103 g of water. To that I added 68 g of vigorous starter. Of that 225 g total mixture, I poured 122 g into a glass jar and loosely coverd with a plastic lid. The glass jar was placed in a temperature controlled chamber in front of a camera. The temperature was monitored and never significantly deviated from 79 deg. or 80 deg. F. For a period of about 12 hours, one picture was taken every 5 minutes, resulting in 150 images.

Results

I selected eight of the 150 images to put here. In each image, you will see that I have inserted a set of numbers at the top center. These numbers represent the duration, in hours and minutes, at the time the image was recorded. So, the first image is “00:00”:

00 hours 00 minutes

The next image is after 2 hours and 26 minutes have elapsed:

snapshot-20070105-140039.jpg

At 02:26 you see the normal layer of “hooch” forming. I did not know until I did this experiment that it first forms at the top of the starter. You also see the bubbles of gas forming in the starter, causing the starter to “rise” as it would when used to leaven bread dough. The hooch and gas are the waste products from the yeast and bacteia, the populations of which are beginning to grow rapidly.
At 03:16 the starter has risen a good bit. The hooch layer is
snapshot-20070105-145044.jpg

getting pushed to one corner as the center bulges.

At 03:26 there is another unexpected phenomenon.

snapshot-20070105-150044.jpg

The corner where the hooch was is foaming violently. I say violently because this all took place on a time scale of 5 or10 minutes. This is after almost an hour and a half of liesurly, predictable rise in the starter volume and number of gas bubbles (correlate with population of micro-organisms). I watched this occure on the monitor, bemoaning the fact that all this excitement would be lost to posterity because I had decided to record only one image every 5 minutes. I would have needed a couple of images a second to capture all this short-term activity, which began suddenly and without warning and did not last long at all. I gripped the edge of my seat and practically left greasy nose-marks on my monitor, wondering what this portended for my little microbe-cosm.

At 03:46 the foam is leaving. Where did the hooch go?
snapshot-20070105-152048.jpg

If you look closely you can see the hooch is now all the way at the bottom of the jar.

At 06:26 you see you can’t keep good hooch down.

snapshot-20070105-180107.jpg

Now there are three distinct layers. Under the hooch is a layer of starter that seems to be inactive because there are no bubbles in it. You can’t see it in a few images, but I can tell you it was still very active. Small chunks and particles were seen both rising and falling in the hooch layer. Since the bottom layer was growing, it must be that more was falling than rising. Does this remind you of the economy and the extinction of the middle class?

At 07:01 you can see the first settling of the top layer.
snapshot-20070105-183612.jpg

This tells us that the yeast and bacteria are beginning to die off. They have used up their resource (flour) and are now starving and succumbing to the poisonous effects of their waste products. It looks like the peak occured a bit after six hours in this experiment.

At 14 hours and 30 minutes I ended the experiment.
snapshot-20070106-000205.jpg

The top layer is at its lowest level since its peak. Once it started falling, the fall was pretty monotonous. I could have let it run longer but it had been a long day and this felt very much like the end of history.

Conclusion

Can we take any macro lessons from this micro-biological model? There are some important differences. Our planet, unlike the starter jar that got only one charge of flour, is being re-charged daily with “free” energy from the sun.

The trouble is, we have not been living within the energy budget of the sun since technology allowed us to exploit oil and greed made it inevitable. The energy density of “black gold” cannot be matched by solar, wind, geothermal, etc. Nuclear has a waste problem and the likelihood of catastrophic accidents increases with time and the number of reactors in use.

We may be running out of time to reverse the toxic byproduct of burning fossil fuels: global warming. It may be too late. It could accelerate tenfold or more without warning (remember the foam and the inversion of the hooch layer happened catastrophically). Indeed, there may be evidence of such an acceleration now, see: “Global Warming Already Causing Extinctions, Scientists Say“, by Hannah Hoag for National Geographic News, Nov. 28, 2006.

These sudden accelerations and unpredictable changes can happen in non-linear systems that are under stress. A little push in a certain direction causes changes that themselves add to the push and you get exponential acceleration. The hooch layer suddenly inverts. The die-off caused by global warming or the loss of oil as an energy source could also happen more quickly than predicted by the most dire of doomsayers.

Here is a very good reference for those interested in reading more on the topic of ecosystems that experience overshoot and sudden extinction: “Overshoot in a Nutshell” by David M. Delany.